Clin Res Cardiol (2023). https://doi.org/10.1007/s00392-023-02180-w
|
|
Incremental utility of circulating biomarkers for cardiovascular risk prediction beyond the updated SCORE2 model
|
|
J. Lehmacher1, B. Toprak1, A. Goßling1, L. Iacoviello2, B. Thorand3, A. Linneberg4, V. Salomaa5, K. Kulasmaa5, S. Sans6, M. M. Ferrario7, S. Söderberg8, F. Kee9, L. Palmieri10, C. Donfrancesco10, W. König11, A. Peters11, H. Tunstall-Pedoe12, T. Zeller1, S. Blankenberg1, J. T. Neumann1, R. Twerenbold1, für die Studiengruppe: BiomarCaRE
|
|
1Klinik für Kardiologie, Universitäres Herz- und Gefäßzentrum Hamburg, Hamburg; 2Department of Epidemiology and Prevention, IRCCS Mediterranean Neurological Institute NEUROMED, Pozzilli, IT; 3German Research Center for Environmental Health (GmbH), Institute of Epidemiology, Helmholtz Zentrum München, Neuherberg; 4Center for Clinical Research and Prevention, Bispebjerg and Frederiksberg Hospital, Glostrup, DK; 5National Institute for Health and Welfare, Helsinki, FI; 6Department of Health, Institute of Health Studies, Barcelona, ES; 7Research Center In Epidemiology and Preventive Medicine (EPIMED), Department of Medicine and Surgery, University of Insubria, Varese, IT; 8Department of Public Health and Clinical Medicine, and Heart Centre,, Umeå University, Umeå, SE; 9Centre for Public Health, Queens University of Belfast, Belfast, UK; 10Department of Cardiovascular, Endocrine-metabolic Diseases and Aging, Instituto Superiore di Sanità, Rom, IT; 11Deutsches Herzzentrum München, München; 12Cardiovascular Epidemiology Unit, University of Dundee, Ninewells Hospital & Medical School, Dundee;
|
Background: Most scores estimating the risk for cardiovascular disease (CVD) consider only traditional cardiovascular risk factors. Currently it is unclear, whether risk prediction may be further improved by addition of circulating biomarkers. Our aim was to evaluate the incremental utility of four widely applied and established biomarkers to improve the prediction of 10-year CVD-risk beyond the recently updated SCORE2 model.
Methods: In a harmonized dataset of ten longitudinal, population-based cohorts from seven European countries, we applied SCORE2 and assessed the incremental prognostic utility of the following biomarkers: hs-cTnI, NT-proBNP, hs-CRP as well as creatinine- and cystatin C-based estimated eGFR. Primary outcome was incidence of CVD at 10 years, defined as the composite of cardiovascular mortality, non-fatal myocardial infarction and non-fatal stroke. We used Fine and Gray models adjusted for competing-risk and SCORE2 variables as well as penalized cubic splines to assess and visualize the association of biomarkers with incident CVD. In a multimarker approach, backward selection was performed to identify potential biomarkers providing independent predictive value beyond SCORE2-components. Further, C-indices and category-free net reclassification index (cfNRI) were used to compare the discriminative performance of the original SCORE2 model to the biomarker-extended model.
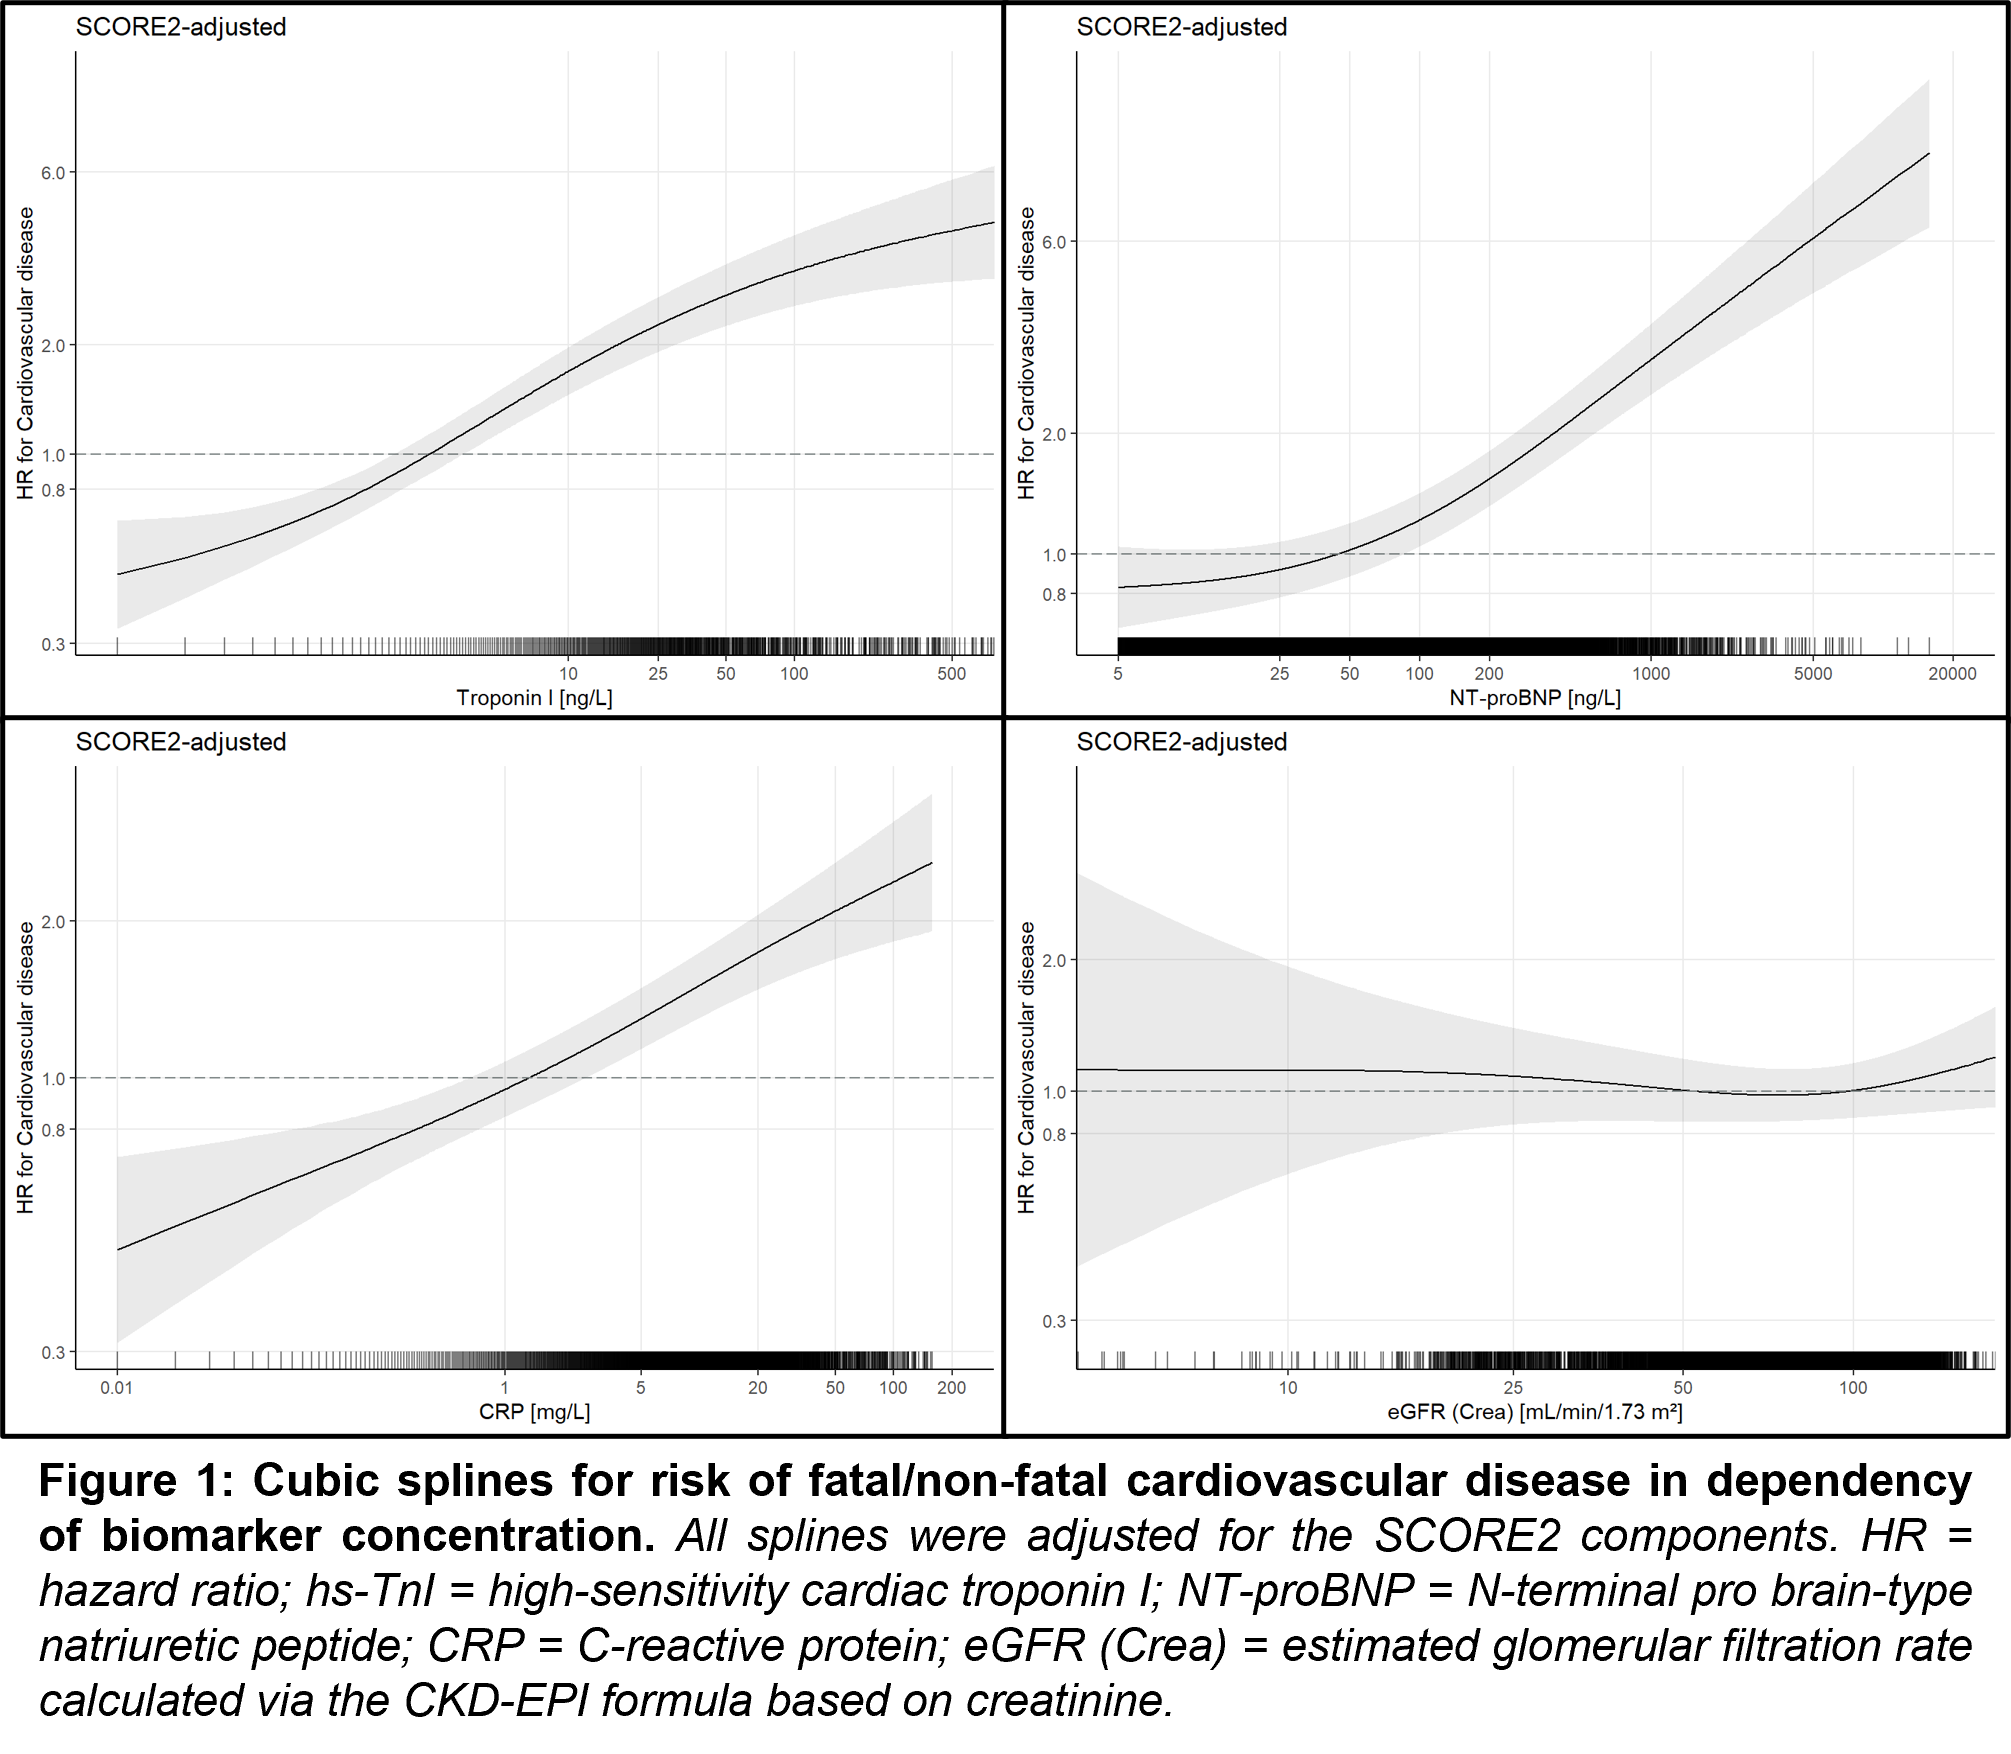
Results: In 78’499 individuals, median age was 50 years and 50.3% were females. NT-proBNP, hs-CRP and hs-cTnI but not eGFR provided incremental predictive value for 10-year CVD-risk when individually added to SCORE2 (Figure 1). In a multimarker approach all three biomarkers were independent predictors for CVD beyond SCORE2 (Table 1). Simultaneous addition of these biomarkers to the SCORE2 model significantly increased discrimination [C-index; 0.802 (95% CI, 0.771, 0.833) versus 0.813 (95% CI, 0.783, 0.844), delta 0.011 (95% CI, 0.007, 0.016)] and risk reclassification, [cfNRI 0.17 (95% CI, 0.12, 0.22)].
Conclusions: If added to the SCORE2 risk-prediction model NT-proBNP, hs-CRP and hs-cTnI but not eGFR provide incremental predictive value for 10-year CVD risk and may therefore help to further improve personalized CVD-risk prediction.
|
Original SCORE2 (w/o biomarkers) |
SCORE2 PLUS biomarkers |
|
|
Variable |
sHR (95% CI) |
p-value |
sHR (95% CI) |
p-value |
|
SCORE2 components |
|
|
|
|
|
Examination age, years (transformed) |
1.74 (1.63, 1.84) |
<0.001 |
1.60 (1.51, 1.70) |
<0.001 |
|
Systolic BP, mmHg (transformed) |
1.29 (1.23, 1.35) |
<0.001 |
1.19 (1.14, 1.25) |
<0.001 |
|
Total cholesterol, mmol/L (transformed) |
1.17 (1.12, 1.22) |
<0.001 |
1.19 (1.14, 1.24) |
<0.001 |
|
HDL cholesterol, mmol/L (transformed) |
0.75 (0.69, 0.80) |
<0.001 |
0.77 (0.72, 0.83) |
<0.001 |
|
Diabetes |
2.73 (2.30, 3.23) |
<0.001 |
2.56 (2.16, 3.03) |
<0.001 |
|
Male sex |
1.98 (1.76, 2.23) |
<0.001 |
2.14 (1.89, 2.41) |
<0.001 |
|
Current smoker |
1.95 (1.75, 2.18) |
<0.001 |
1.82 (1.63, 2.04) |
<0.001 |
|
Biomarkers |
|
|
|
|
|
NT-proBNP, log(ng/L) |
- |
|
1.33 (1.26, 1.41) |
<0.001 |
|
High-sensitivity CRP, log(mg/L) |
- |
|
1.18 (1.13, 1.24) |
<0.001 |
|
High-sensitivity Troponin I, log(ng/L) |
- |
|
1.16 (1.09, 1.24) |
<0.001 | |
|
Table 1: Fine and Gray regression models for the original SCORE2 and SCORE2 with added biomarkers using backward selection to predict cardiovascular disease at 10 years. Log transformation was performed for the investigational biomarkers; transformation of continuous SCORE2 components was performed according to the original SCORE2 publication. |
|
https://dgk.org/kongress_programme/jt2023/aV631.html
|