Background: Veno-arterial extracorporeal membrane oxygenation (VA-ECMO) is applied in patients with refractory hemodynamic failure. Exposure of blood components to high shear stress and the large extracorporeal surfaces in the ECMO circuit trigger a complex ECMO-associated inflammatory response syndrome and an ECMO-induced coagulopathy which are believed to worsen the already poor prognosis of these patients. Mass spectrometry-based proteomics allow a detailed characterization of the serum proteome as it provides the identity and concentration of vast numbers of individual proteins at the same time. In this exploratory study, we aimed to characterize the serum proteome of patients receiving VA-ECMO over time and compared to controls. Moreover, we aimed to identify serum proteomic features related to outcome.
Methods: Serum samples were collected on day 1 and day 3 from patients receiving VA-ECMO on the medical and heart surgical intensive care wards of the University Hospital in Freiburg. Samples underwent albumin and immunoglobulin depletion, in-solution digestion and PreOmics clean-up. A spectral library was built with multiple measurements of a master-mix sample using variable mass windows. Individual samples were measured in data independent acquisition (DIA) mode. Raw files were analyzed by DIA-neural network. Unique proteins were log transformed and quantile normalized. Differential expression analysis was conducted with the LIMMA – R package. EnrichROAST was applied to generate gene ontology enrichment analyses
Results: Fifteen patients receiving VA-ECMO were recruited (10 male, 5 female). Six healthy control patients were also recruited. The main indication for VA-ECMO was cardiogenic shock. Eight patients survived. 351 unique proteins were identified. 139 proteins were differentially expressed between ECMO patients and healthy controls. Enrichment analysis revealed that many of these proteins were involved in stress response, coagulation and the inflammatory response. 144 proteins were differentially expressed on day 3 compared to day 1. According to enrichment analysis, proteins required for tissue migration were downregulated on day 3, whereas proteins required for vesicle formation were upregulated. Moreover, many of the differentially regulated proteins on day 3 vs. day 1 could be attributed to the complement (e.g., Complement factors P, D and I, C1, C2, C4B, C6, C8A, C9) and coagulation (e.g. FV, FXII, VWF, Plasminogen) system. On day 3, 50 proteins were differentially expressed between survivors and non-survivors. Of these 50 proteins, many have also been ascribed to processes in coagulation and inflammation (e.g., Factor IX, Protein-C, Kallikrein, SERPINA10, SEMA4B, Complement C3, Complement Factor D and MASP-1).
Conclusion: The serum proteome of VA-ECMO patients displays major differences compared to controls, it changes during VA-ECMO from day 1 to day 3 and allows differentiation of survivors and non-survivors on day 3 of VA-ECMO. Serum proteomic changes between day 1 and day 3 affect many proteins involved in inflammatory or coagulation processes. Proteins differentially expressed between survivors and non-survivors on day 3 may constitute future biomarker candidates.
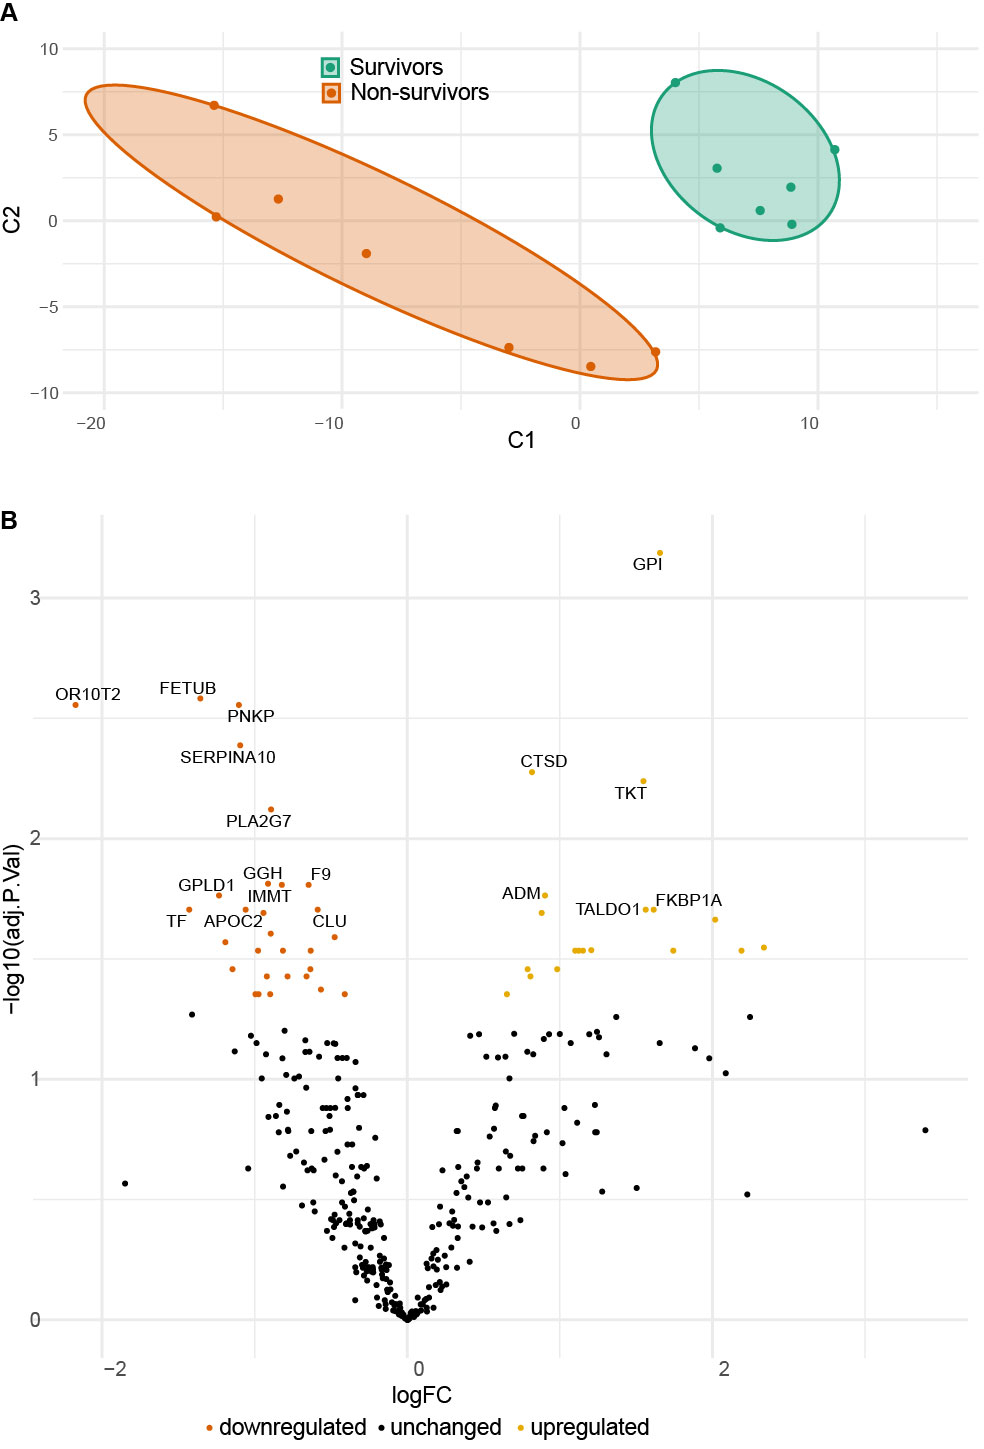
Figure 1: Serum proteomes of survivors and non-survivors on day 3. A Principal component analysis (C1 - principal component 1, C2 principal component 2). B Volcano plot illustrating differential protein expression between survivors and non-survivors.
Figure 1: Serum proteomes of survivors and non-survivors on day 3. A Principal component analysis (C1 - principal component 1, C2 principal component 2). B Volcano plot illustrating differential protein expression between survivors and non-survivors.
https://dgk.org/kongress_programme/jt2023/aP1348.html